

 Skip to content
AI Algorithms & Developer Tools: Unleash Powerful Data Visualization with FusionCharts
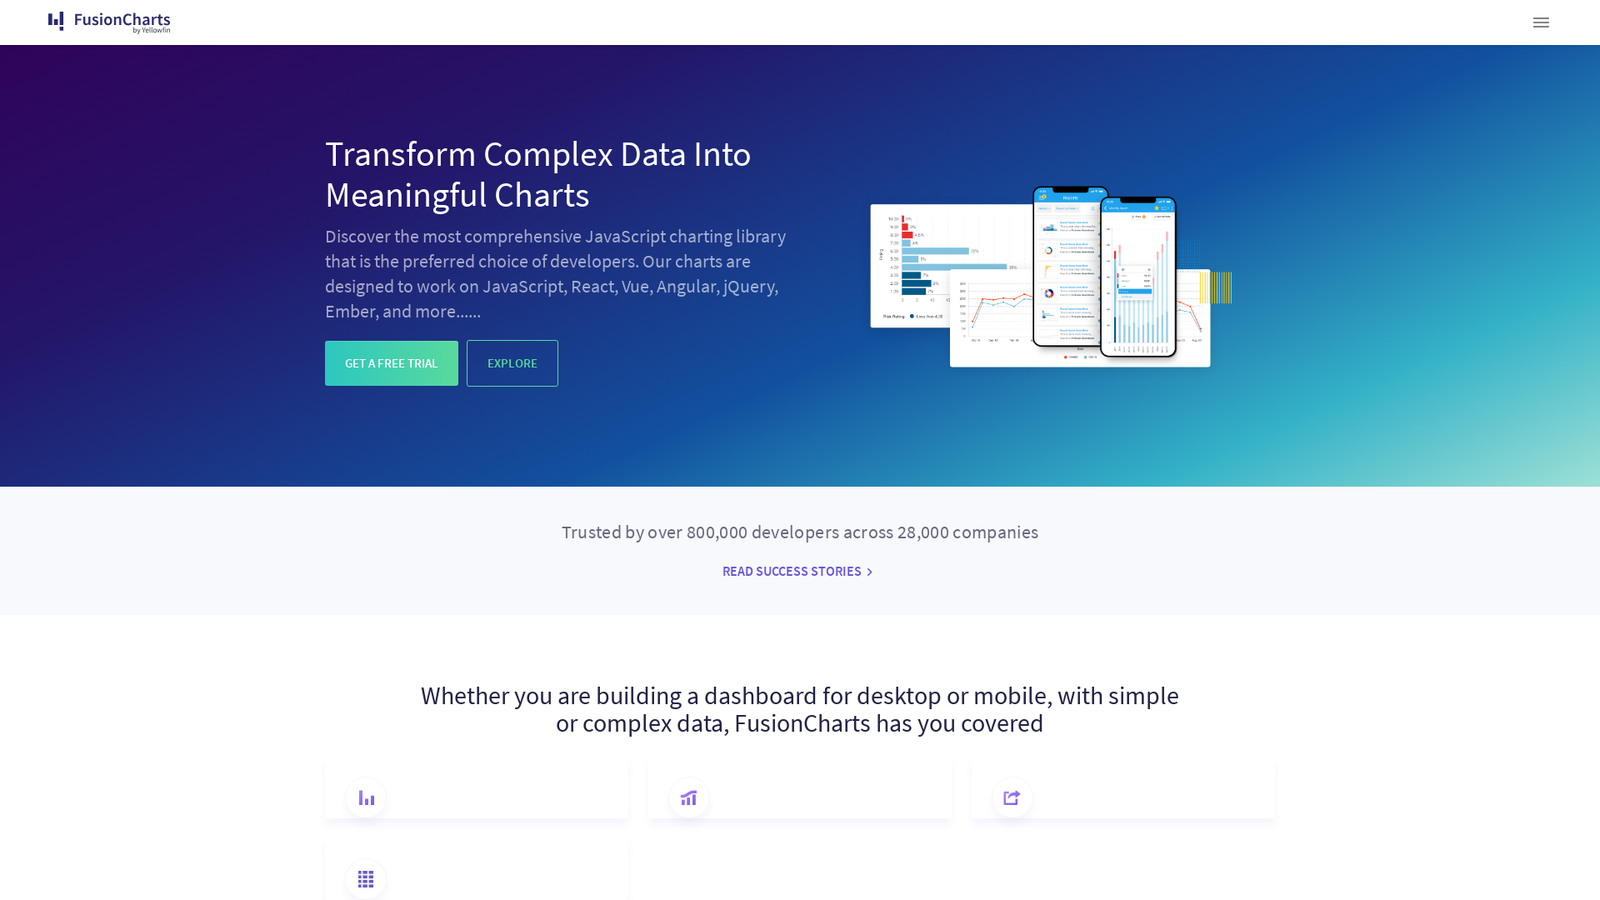
AI algorithms are revolutionizing data analysis, but translating insights into understandable visuals is crucial. This is where FusionCharts shines as a leading JavaScript charting library, empowering developers to create stunning interactive visualizations. With over 90 chart types and 1000+ maps at your disposal, FusionCharts caters to diverse data storytelling needs. Its intuitive API and extensive customization options ensure seamless integration into any application, allowing you to communicate complex information clearly and effectively. Trusted by 27,000 customers worldwide, FusionCharts delivers high-performance, scalable solutions that elevate data visualization to new heights.
Pricing
FusionCharts offers a variety of subscription-based pricing plans for its charting libraries and tools. They provide options tailored to individual developers, businesses, or large enterprises. The exact pricing details are not clearly displayed on the provided website, but it mentions different tiers with varying features and functionalities. They also offer a free trial to explore their products before committing to a subscription. Here's a summary of the key points: Subscription-based pricing: FusionCharts uses a subscription model for access to its charting libraries and tools. Multiple tiers: They offer different pricing tiers likely based on usage, features, or number of users. Free trial available: Users can try out FusionCharts products before purchasing with a free trial period. Specific pricing details unavailable: The website doesn't clearly display the exact cost for each tier. To get detailed pricing information, you would need to contact their sales team or explore their official website further.


How would you rate FusionCharts?