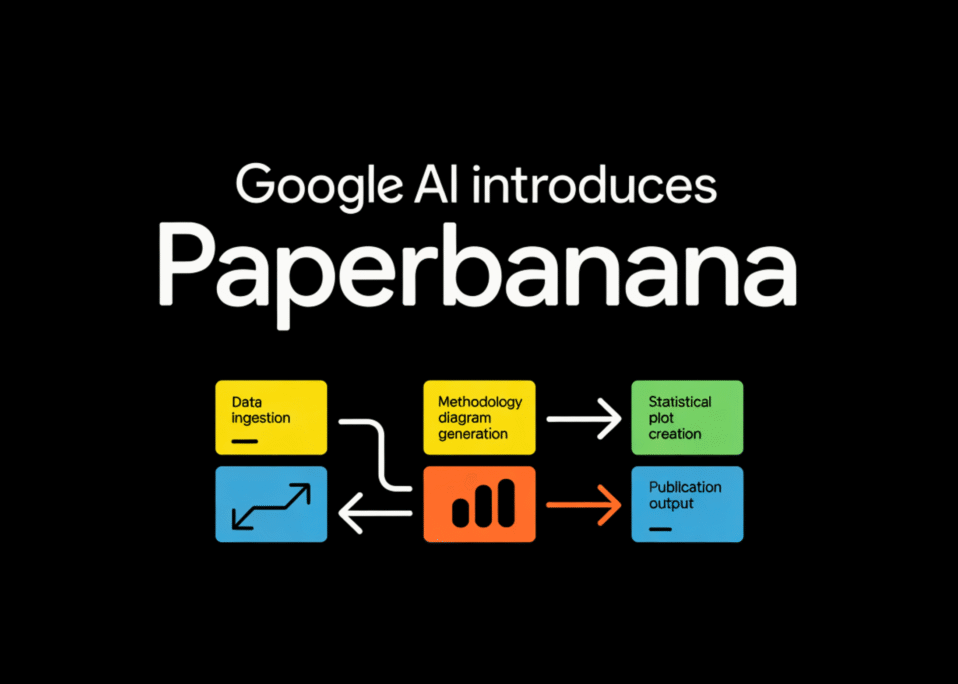
PaperBanana is an agentic framework developed by Google AI designed to automate the creation of publication-ready methodology diagrams and statistical plots. It solves the tedious and time-consuming process of generating complex visualizations required for academic papers and technical reports. The tool is primarily designed for researchers, data scientists, and students who need to produce high-quality figures quickly and consistently. By leveraging AI agents, it streamlines the visualization workflow, ensuring accuracy and saving significant manual effort.
Key Features and Capabilities
PaperBanana offers a suite of features tailored for scientific visualization. Its core capability is the automated generation of methodology diagrams, such as flowcharts and architecture overviews, from textual descriptions or code. Users can input a paragraph describing their process, and the framework constructs a structured diagram. For statistical plots, it supports a wide range of chart types including bar graphs, line plots, scatter plots, and distribution charts, automatically handling data parsing and aesthetic optimization.
A unique selling point is its adherence to publication standards. PaperBanana ensures that all generated figures meet the formatting requirements of major academic venues (e.g., IEEE, ACM, NeurIPS), including font sizes, line weights, and color schemes suitable for both print and digital formats. The tool also provides customization options, allowing users to fine-tune generated visuals. Unlike manual tools like Matplotlib or R’s ggplot2, which require extensive coding, PaperBanana operates on a high-level, intent-based interface.
How It Works / Technology Behind It
The framework utilizes a multi-agent system powered by large language models (LLMs) and vision models. When a user provides input—whether it’s a dataset, a textual description of a process, or raw code—the system decomposes the task into sub-tasks handled by specialized agents. One agent interprets the statistical data and selects the appropriate plot type, while another focuses on the semantic layout of methodology diagrams.
These agents interact with a code execution environment (like Python with libraries such as Matplotlib and Seaborn) to generate the visual assets. The system iteratively refines the output based on visual feedback and user constraints. This agentic approach allows for complex reasoning, such as inferring the correct statistical test to visualize or arranging a multi-step process into a coherent flowchart. The technology is integrated into the broader Google AI ecosystem, leveraging models like PaLM or Gemini for natural language understanding.
Use Cases and Practical Applications
PaperBanana is invaluable in several real-world scenarios. For academic researchers, it can rapidly generate figures for a manuscript draft, allowing them to focus on analysis rather than plotting. A data scientist could use it to create quick visualizations for an exploratory data analysis (EDA) report, saving hours of coding time. In educational settings, instructors can use it to create teaching materials with consistent, high-quality diagrams.
Another specific use case is in collaborative environments. Teams can standardize their visual output, ensuring that all figures in a shared document or presentation follow the same style guide. For grant proposals, where visual impact is crucial, PaperBanana can quickly produce compelling figures that communicate complex methodologies to reviewers. It is particularly useful for those who are not proficient in programming but need sophisticated plots, bridging the gap between conceptual understanding and visual execution.
Pricing and Plans
As of its introduction, PaperBanana is a research framework from Google AI. It is not yet a commercial product with a standard pricing model. Typically, Google AI research tools are released as open-source code or through research previews. Users can likely access it via Google Colab or through a dedicated GitHub repository. There is no information regarding a freemium or enterprise tier at this stage.
For those looking for similar capabilities with established pricing, alternatives like Plotly Chart Studio (freemium) or Tableau (paid) offer visualization services. However, PaperBanana’s value proposition lies in its automation and integration with the Google AI stack. If it becomes a commercial product, it might follow a usage-based model similar to other Google Cloud AI services, charging per generation or API call.
Pros and Cons / Who Should Use It
Pros:
* Time Efficiency: Drastically reduces the time spent on creating complex figures.
* Standardization: Enforces publication-ready formatting automatically.
* Accessibility: Lowers the barrier for non-coders to create professional statistical plots.
* Integration: Seamlessly works with Python code and data formats common in research.
Cons:
* Research Stage: As a new framework, it may lack the stability and extensive documentation of mature tools.
* Limited Customization: While customizable, it might not offer the granular control that manual coding provides for highly specific needs.
* Dependency: Reliance on Google’s models and infrastructure.
Who Should Use It:
PaperBanana is ideal for academic researchers, PhD students, and data analysts who need to produce high-quality figures efficiently. It is also suitable for technical writers and educators who require consistent visual aids. However, professional graphic designers seeking pixel-perfect, artistic control might prefer dedicated design software.
🎯 KEY TAKEAWAY
If you only take one thing from this, make it these.
Hide
- PaperBanana automates the creation of methodology diagrams and statistical plots using an agentic AI framework.
- It is designed to save time for researchers and data scientists by generating publication-ready figures that adhere to academic standards.
- The tool uses a multi-agent system to interpret text or code and generate visuals, offering a balance between automation and customization.
- As a research framework, it is likely open-source or available via a research preview, with no confirmed commercial pricing yet.
- It is best suited for those prioritizing speed and standardization over granular manual control.
FAQ
What is PaperBanana and who is it for?
PaperBanana is an AI framework from Google that automates the generation of methodology diagrams and statistical plots. It is designed for researchers, students, and data scientists who need to create publication-ready visualizations quickly without extensive manual coding.
How does PaperBanana differ from using Python libraries like Matplotlib?
While Matplotlib requires writing code for every plot, PaperBanana uses natural language prompts to generate visuals automatically. It focuses on high-level intent and ensures the output meets specific publication formatting guidelines, whereas manual coding offers more granular control but is more time-consuming.
Is PaperBanana available for free?
As a research introduction, PaperBanana is likely available as an open-source tool or through a research preview. There is currently no information on commercial pricing or subscription plans, but access is probably free for research purposes.
Can I customize the diagrams generated by PaperBanana?
Yes, the framework includes customization options. Users can adjust parameters, colors, and layouts after the initial generation. However, it may not offer the same level of low-level control as writing raw code from scratch.
What are the best alternatives to PaperBanana?
Alternatives include manual coding with Python (Matplotlib, Seaborn) or R (ggplot2), which offer full control but require programming skills. Commercial tools like Tableau or Plotly provide drag-and-drop interfaces but often come with subscription costs. PaperBanana differentiates itself by automating the process via AI agents.
Does PaperBanana support integration with existing data workflows?
Yes, it is designed to work with standard data formats and code environments common in research, such as Python scripts and CSV files. It integrates into the workflow by taking raw data or descriptions as input and outputting ready-to-use figures.


How would you rate Google’s PaperBanana: Automating Groundbreaking AI Research Visualizations?