Takeaways
– Baidu’s stock is showing bullish signals as it enters the third wave of a larger uptrend
– Technical analysis suggests the stock is poised to continue its rally in the coming months
– Investors and traders should watch for key support and resistance levels to guide their trading decisions
– The next major resistance level is around $240, which could act as a potential target for the current wave
– A break below $210 would invalidate the bullish thesis and indicate a potential trend reversal
Baidu Bullish, Entering Wave 3 of 3 Uptrend for NASDAQ:BIDU
Baidu (NASDAQ: BIDU), the leading Chinese technology company, is showing signs of a bullish trend as it enters the third wave of a larger uptrend, according to technical analysis by waverity.
Baidu’s Bullish Wave Structure
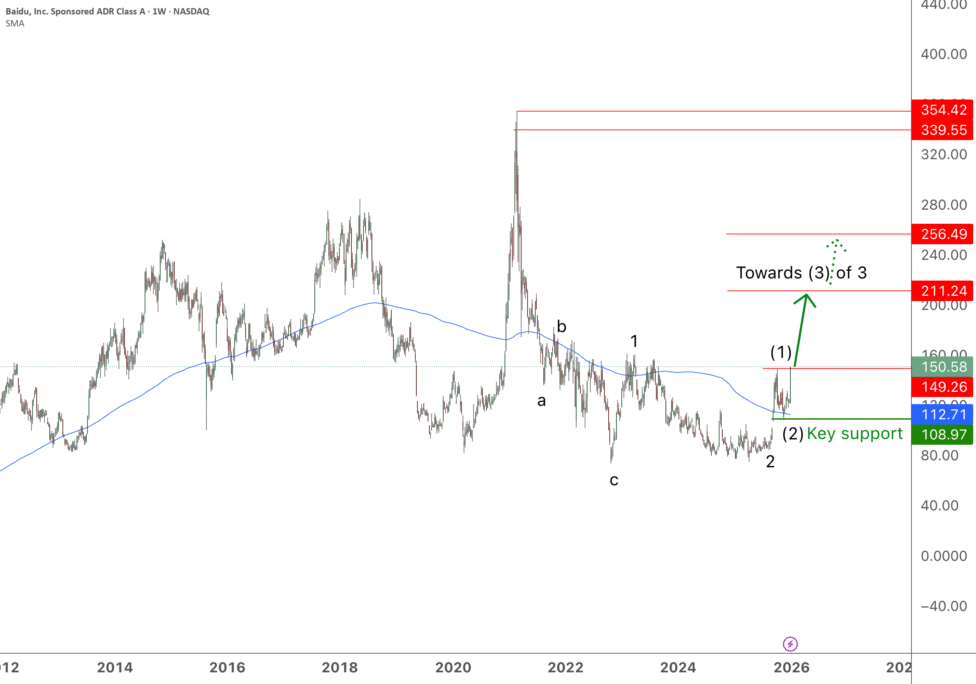
The analyst’s chart analysis suggests that Baidu’s stock is currently in the third wave of a three-wave pattern, indicating a continuation of the overall uptrend. This wave structure is a common pattern observed in Elliott Wave theory, a technical analysis approach that aims to identify and forecast market trends.
**Key Observations:**
– Baidu has completed the first two waves of the larger uptrend
– The stock is now entering the third wave, which is typically the strongest and most impulsive phase of the pattern
– The next major resistance level is around $240, which could act as a potential target for the current wave
**Support and Resistance Levels:**
– The stock is currently trading above the $210 level, which serves as an important support area
– A break below $210 would invalidate the bullish thesis and suggest a potential trend reversal
– Investors and traders should closely monitor these key support and resistance levels to guide their trading decisions
Implications for Baidu Investors
The bullish wave structure identified by the analyst suggests that Baidu’s stock could continue its rally in the coming months, providing opportunities for investors and traders to potentially benefit from the uptrend.
**Potential Upside Targets:**
– The $240 level represents a significant resistance area that, if breached, could open the door for further gains
– Traders may consider targeting this level as a potential price objective for the current wave
**Risk Management:**
– Investors should be mindful of the $210 support level and be prepared to reevaluate their positions if the stock breaks below this critical support
– Proper risk management, such as setting stop-loss orders, can help protect against potential downside risks
Conclusion
Baidu’s stock is exhibiting a bullish wave structure, suggesting that the company’s shares could continue their upward momentum in the near future. Investors and traders should closely monitor the key support and resistance levels identified by the analyst to guide their trading decisions and potentially capitalize on the ongoing uptrend.
FAQ
What is the current wave structure for Baidu’s stock?
According to the technical analysis, Baidu’s stock is currently in the third wave of a larger three-wave uptrend pattern. This wave structure is a common pattern observed in Elliott Wave theory, which aims to identify and forecast market trends.
What is the significance of the third wave?
The third wave is typically the strongest and most impulsive phase of the pattern. This suggests that Baidu’s stock could continue its rally in the coming months, providing opportunities for investors and traders to potentially benefit from the uptrend.
Where is the next major resistance level for Baidu’s stock?
The analyst has identified the $240 level as the next major resistance area for Baidu’s stock. If this level is breached, it could open the door for further gains in the stock price.
What is the critical support level to watch for?
The $210 level is an important support area for Baidu’s stock. A break below this level would invalidate the bullish thesis and suggest a potential trend reversal, which investors should be prepared to reevaluate their positions accordingly.
How can investors and traders manage the risks associated with Baidu’s stock?
Proper risk management, such as setting stop-loss orders, can help protect against potential downside risks. Investors and traders should closely monitor the key support and resistance levels identified by the analyst to guide their trading decisions and manage their exposure to the stock.
What are the potential upside targets for Baidu’s stock?
The analyst has identified the $240 level as a significant resistance area that, if breached, could open the door for further gains in Baidu’s stock price. Traders may consider targeting this level as a potential price objective for the current wave.


How would you rate Baidu’s Breakthrough AI Innovations Poised for Explosive Growth?